Announcing Merch Analytics – New Merch Informer Module

Today Merch Informer has launched an incredibly important update! The Merch Analytics module will allow you to use data to make the hard decisions in your business. These analytics will guide you on what direction your business needs to go in instead of blinding guessing what you should do next.
So how does it work?
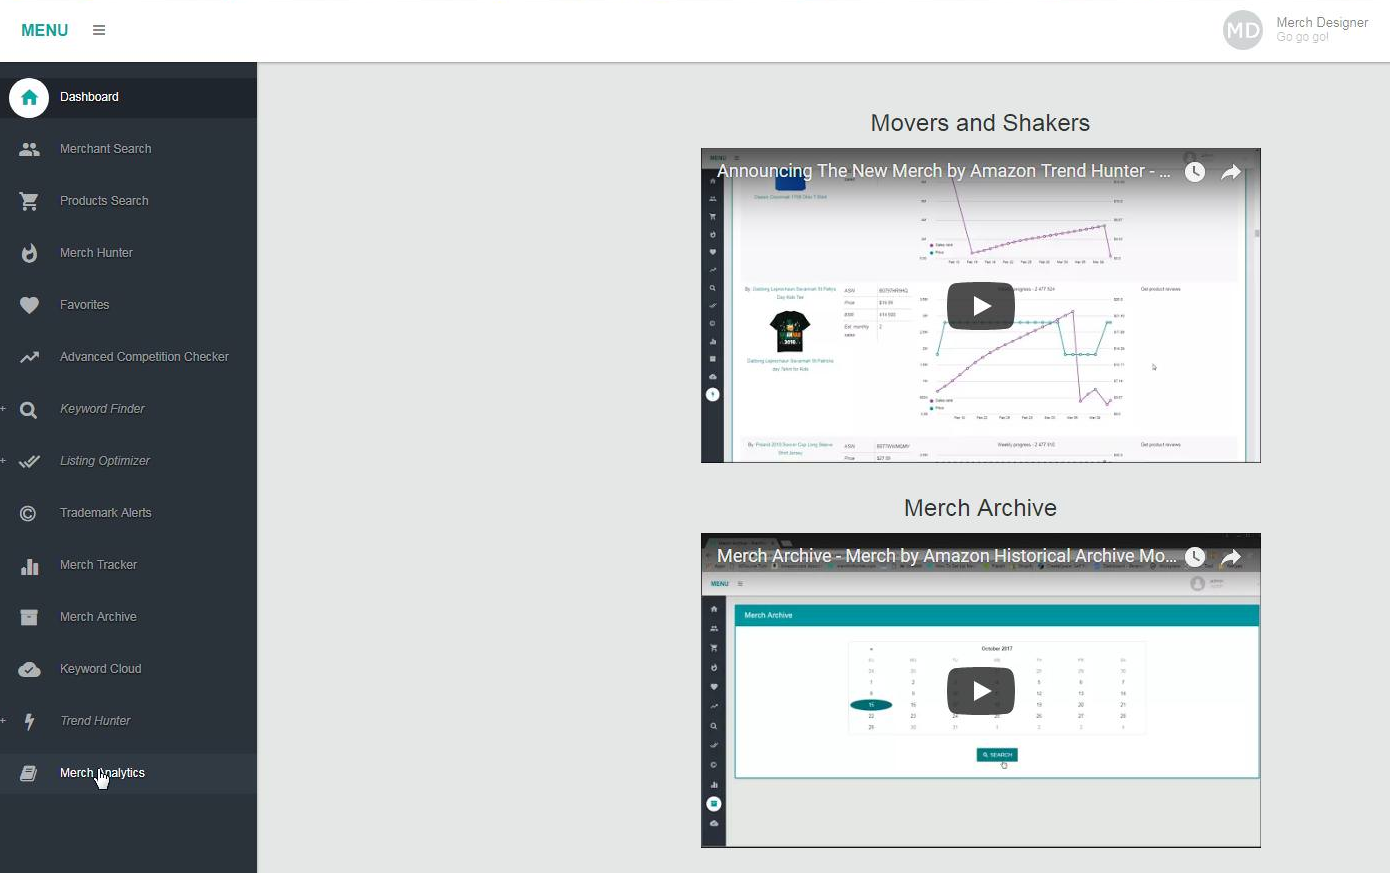
Step 1: Log in to Merch Informer
You will see the dashboard. The Merch Analytics module is at the bottom in the left hand menu.
Step 2: Download Merch CSVs
In order for this module to display the crucial information you need, download the CSV reports from your Merch by Amazon account. You will probably need to download more than 1 as you can only download 90 days activity at a time.
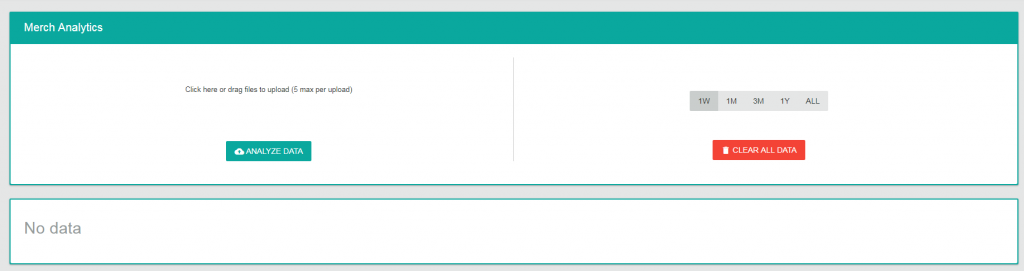
Once you have downloaded the CSVs, drag and drop them into the box on the left that allows you upload 5 CSV files at a time. You can always add more, just 5 at a time!
Step 3: Upload CSVs
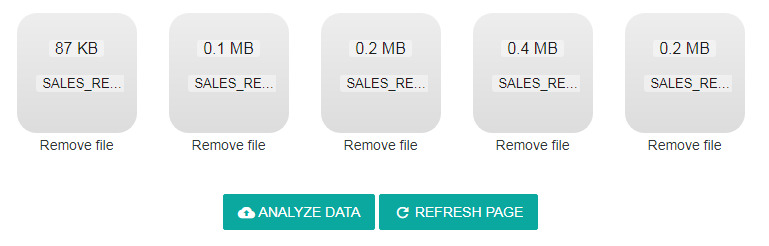
Once you drag and drop them, they will look like this:
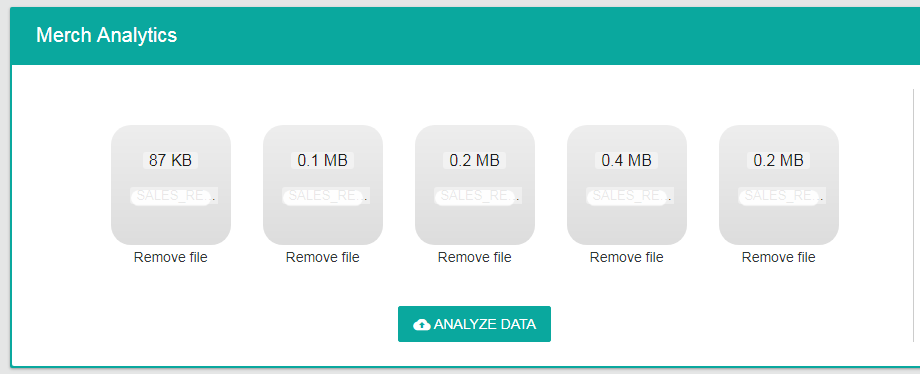
Click on Analyze Data to upload them!
You will then need to click on the refresh page button to display the data:
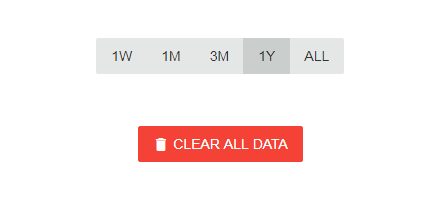
Step 4: Select a date period
Once you have all your CSVs uploaded to the Merch Analytics module, you will need to select a date period that you want to take a look at.
Note: Selecting 1 month will display information for the last 30 days from the date you upload the files on.
Step 5: Analyze the data!
Now that you have everything uploaded, you can finally take a look at the data given to you.
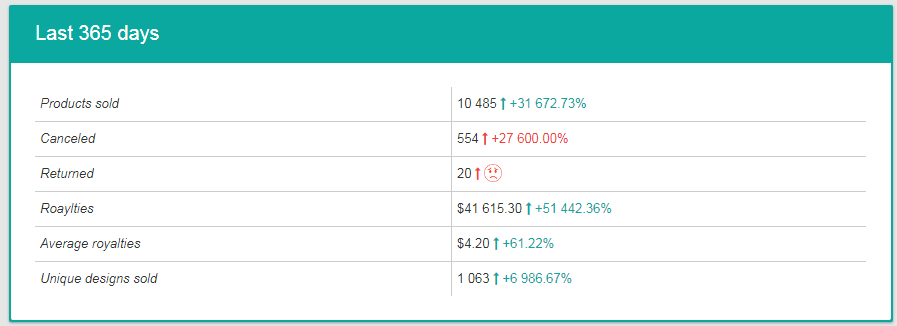
The first box is going to show you stats for the time period you have selected. For this demo, since I just finished up the 12 month case study on my girlfriend’s account, we are going to use her data.
We selected a year, and this is what data it shows:
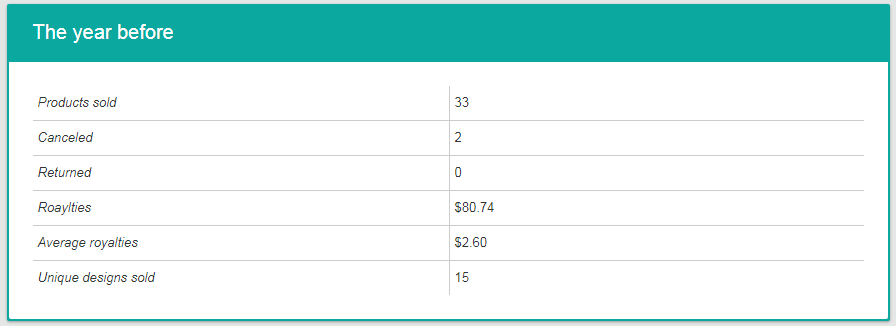
The box to the right will display the previous year before the last 365 days. Since we did not upload every single CSV we had, these numbers are a bit off, but you can see the massive growth in the account.
The sales report box below the above two data boxes is going to give you data on how you are doing each and every day. You have a few options here:
- Units
- Canceled
- Returned
- Unique Designs
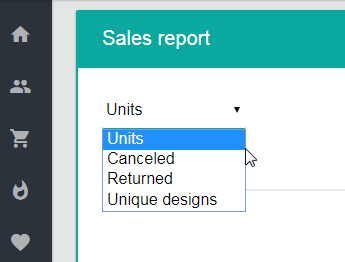
Once you have selected the units, you will see the full graph
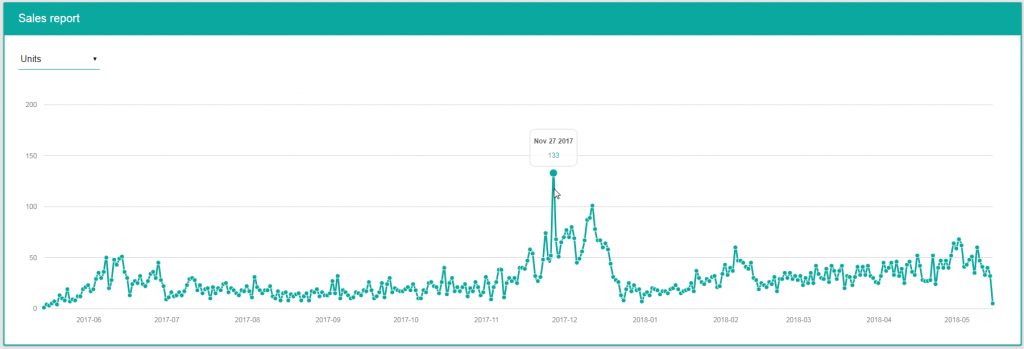
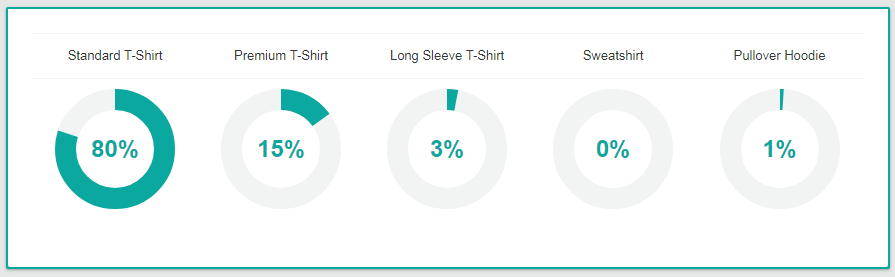
From here, you can take a look at the breakdown of shirt type sold:
As well as the gender:
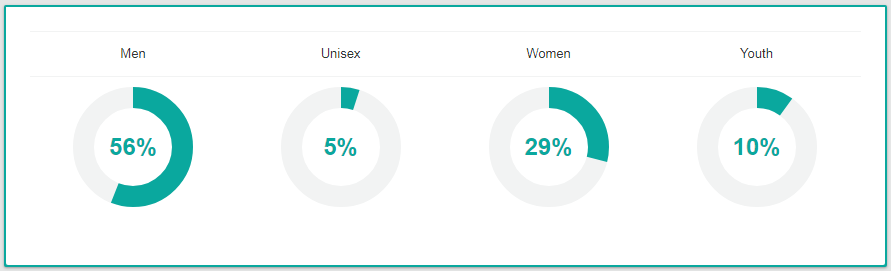
Just like that, you have all the data at your fingertips to tell you what direction your Merch by Amazon business should be going in. As you can see from the points above, the majority of the shirts sold are standard shirts. From here, I can see that selling sweatshirts, might be a waste of time since that is really not counting for any of the royalties this account earned.
As always, make sure you are working smarter and not harder!
Any questions or concerns, please drop them in the comments below

Thanks, Neil. Once again you guys exceed expectations.
This is great! Thanks Neil! Any thoughts about adding color?
This is something that will probably get added in the future.
Wow! Thank you…I was debating on subscribing ( I’m new to Merch with hardly any sells), but it seems that with all the services your product offers, it is an absolute no-brainer that this will definitely help me work smarter! ~Nancy
Great tool to look at trends and analytics. Makes me sad seeing my trend since the start of the year though :/ Thanks for all the value that keeps getting added to MI!!!
Excellent! I just uploaded my first tshirt yesterday, but have been following merch informer youtube account and i have been using its services since 3 weeks ago, it is really nice. I hope to use this feature soon ,as i get on higher tiers and i can upload more than 10 tshirts at a time!
Dude, y’all rock!